Advanced FAQs from Glendale App
FAQs
BackSkip this section if you are just chasing auroras. This is just an explainer of some wider scientific terms and concepts. There is nothing here that you need to know to use Glendale App.
Magnetosphere
What's Magnetospheric Convection?
Magnetospheric convection is the scientific term for the transfer of energy from the IMF both into and out of the magnetosphere. Effectively, the charging of the battery during the growth phase of a substorm and the discharging of the battery during the expansion phase of a substorm.
Academic literature will tell you that solar wind speed plus IMF Bt, By and Bz are the drivers of convection. However, for practical purposes, the only parameters needed to describe the convection process for a substorm are the IMF Bt and Bz at Earth.
What are Loading and Unloading?
Loading and unloading are just alternative terms for convection into and out of the magnetosphere.
During the growth phase, energy is being loaded into the magnetosphere and later this unloads during the expansion phase.
The substorm strength index on Glendale App is the most accurate, real-time proxy for the amount of energy being unloaded into the ionosphere, driving aurora, during the expansion phase.
The image shows the pattern of loading and unloading of the magnetosphere over a 3 day period. You will notice how the substorms (drops on the substorm strength plot) correlate with the Bz (red line) going negative on the IMF plot.
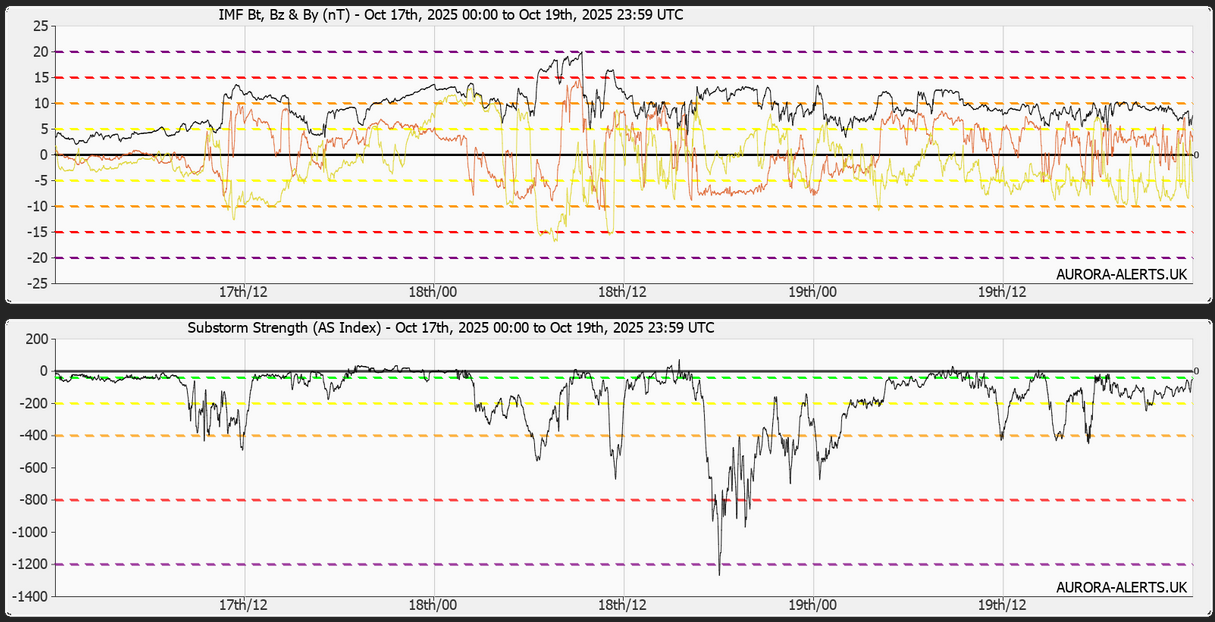
When the Bz goes negative, loading starts. This is the growth phase of the substorm. A short while later, the substorm strength plot begins to drop negative. This is the substorm onset, the start of the substorm expansion phase. When the substorm strength is most negative, we have reached the peak of the substorm. It will then start to rise again as the substorm begins to recover. You can see on the plot that the substorm cycle repeats several times a day in response to the Bz going negative.
What's Dipolarisation (Dipolarization, US)?
Dipolarisation is the main process by which the magnetosphere unloads. During loading, the Earth's magnetic field lines are stretched out like elastic bands into a tail, called the magnetotail, on the dark side of the Earth. Those stretched field lines want to relax and it is when they spring back to their normal, unstretched, dipole state that the stored energy is released, corresponding to the substorm expansion phase.
What is Steady Magnetospheric Convection (SMC)?
Steady Magnetospheric Convection is a mode that the magnetosphere switches into when the IMF Bz stays continually negative for more than one hour. It can sometimes last for many hours, even days. Rather than loading followed by unloading, the magnetosphere simultaneously loads and unloads.
SMC changes the behaviour of the substorm cycle. Normally, when the IMF Bz goes negative a substorm expansion will occur after approximately one hour of the Bz going negative at Earth. During SMC that changes to an average 3.5 hour interval.
A quiet auroral arc typically remains throughout SMC, with occasional bursts of rays on the expansions every few hours.
SMC is fantastic for beginners, as the quiet arc can last the whole night. It allows them to practice their camera skills, experiment with settings, compositions, foregrounds, locations, etc., without the time pressures of a more normal, explosive, expansion phase that might be over in minutes and a single mistake means you blew the opportunity.
Seasoned aurora chasers get bored of SMC. They want it to break.
Expansions will routinely occur during SMC but they are extremely difficult to predict. Sudden, sharp changes in the configuration of the IMF can also shake it out of SMC and induce a good show. Glendale App will tell you what time these will happen as soon as they become apparent in the data.
Coupling Functions
What are Coupling Functions?
Coupling functions are an academic confection. There are literally dozens of them. The idea is that you can create a function whereby you plug in parameters like speed and IMF values. It then tells you how much geomagnetic activity there will be, disguised as the amount of energy being transferred into the magnetosphere.
The academics test these by correlating the output against geomagnetic indices such as Kp, AE, etc.
The one regarded by the academics as being most accurate is called the Newell coupling function. It has this equation:
V4/3BT2/3sin8/3(θc/2)
Where V=speed, BT=Magnitude of IMF in YZ plane, θc=IMF clock angle.
The main uses of coupling functions, that you may have encountered, are Hemispheric Power Index (HPI), Polar Cap Potential (PCP) and Aurorasaurus use one they call 'storm tracker'.
HPI is based upon the Newell coupling function. It is used in SWPC's OVATION model. I've explained the issues with HPI already on the FAQ page. Aurorasaurus is based on one called the Akasofu Epsilon function.
There are three problems with coupling functions:
- The speed term.
- Assumption of direct driving.
- The By (clock) term
I have found no empirical evidence of speed as a driver of magnetospheric convection. Only IMF drives convection. The speed term is not necessary.
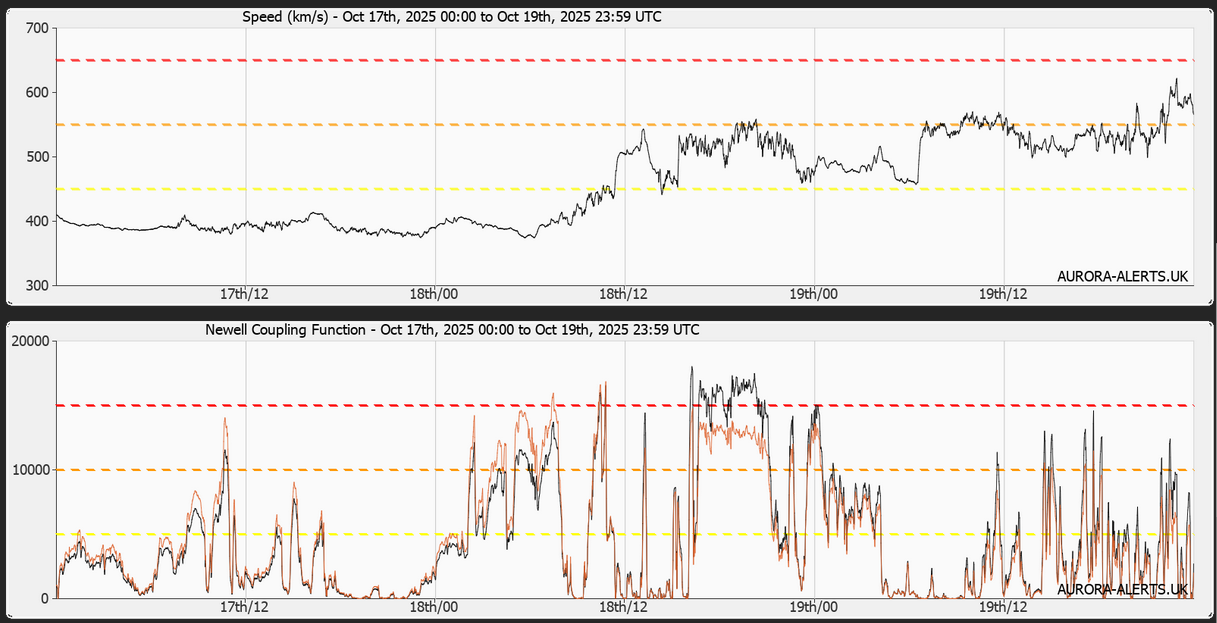
If I plot Newell, as defined, and I also plot Newell but using a fixed speed of 450 km/s, to cancel out the speed term, the two plots are almost identical. The speed term is not really needed.
The image shows a plot of the raw Newell equation (black line) and Newell with a fixed speed of 450km/s, to cancel out the speed term (red line). Notice that the two lines only diverge slightly during extreme changes in the solar wind and it makes little difference to the predicted activity from the coupling function.
When I correlate these plots against substorm strength, I find that, with or without speed, they both perform the same as each other and equally badly against substorm data.
To be fair, Newell does appear to superficially correlate quite well with some bursts of substorm activity. This is because the clock angle term in the equation kicks in whenever Bz goes negative. The problem is the absence of any hysteresis in the equation. When Bz goes negative the coupling function instantly indicates a surge in activity / energy transfer. However, in the real magnetosphere there is a delay while the substorm enters its growth phase before later unloading the accumulated energy during expansion.
The clock angle term also causes problems for coupling functions. This is because, when Bz is positive, increasing By will cause the clock angle to increase. This in turn causes the coupling function to indicate increasing activity. Yet Bz is still positive, no loading is occurring and no substorm will happen.
The image shows an example of how By (bronze line) confuses the HPI and Newell coupling functions in the area marked with a blue box. There are a few tiny substorms during the period due to very short periods of negative Bz (red line). However, Newell and HPI both show a significant rise in predicted activity.
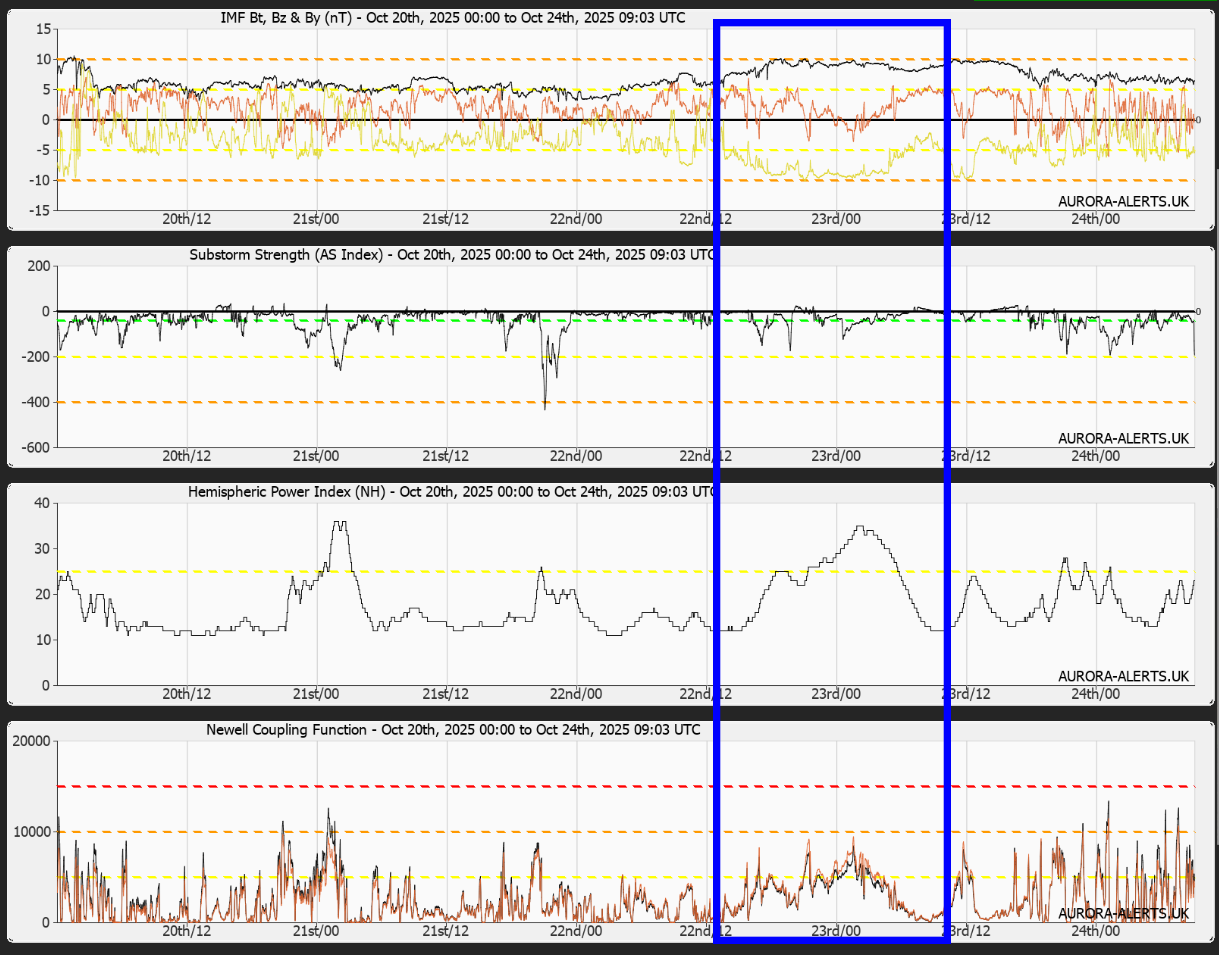
Some on social media will tell you that HPI is a measure of how much 'charge is going into the battery' and how far south the resulting aurora will be visible. It's worth understanding that the loading comes from the periods of negative Bz, not from HPI. Also, the viewlines are dependent on the strength of the substorm during its expansion phase (the drops on the above substorm graph), again not from the HPI. The substorms only last a few hours from beginning to end, whereas HPI would have you believe that hundreds of gigawatts of energy were being injected over long periods, up to 24 hours or more, without any resultant auroral activity. It is the energy being released during the short substorm expansion phase that is powering the aurora and making it visible at lower latitudes.
The best replacement for coupling functions is the Magnetosphere Model within Glendale App. This tracks the loading and unloading of the magnetosphere, accounting for hysteresis, and accurately predicts the times when the peak bursts of activity will occur. The substorm strength indicator on Glendale App is a real-time measurement of the magnetospheric response to the loading and unloading of energy from the solar wind IMF. Substorm strength indicator is not a coupling function or prediction. It is a direct measurement of changes to the Earth's magnetic field that occur during auroral substorms.
GOES Magnetometers
What are GOES Magnetometers?
GOES 18 and 19 are two geo-stationary satellites, one positioned over the east coast of the US and the other just west of the US mainland. They are around 42,000 km above the Earth's surface. Both carry magnetometers that measure the strength of the Earth's magnetic field.
What makes them interesting is that, when it gets dark in the US, these two satellites travel through the Earth's magnetotail and take measurements from directly within the magnetic soup stretched out on the dark side of the Earth.
American aurora influencers rave about GOES satellites being the best way to identify auroral substorm onsets. Unfortunately, there are MANY issues with trying to use GOES satellites for aurora-chasing:
- Cannot be normalised.
- Only work for North America.
- Miss most substorms.
- Often react late to substorms.
- False alerts.
- Proximity.
The main reason why ground-based, substorm tracking is more accurate is that ground-based magnetometers can be normalised. By normalising, we mean that we can pre-determine exactly what the station would read at any time on any quiet day. When readings start to deviate from those norms, we know exactly how far it has moved relative to what is normal. That tells us exactly how strong the deviation is and whether it is a weak or a strong substorm.
A GOES magnetometer cannot be normalised, as conditions are constantly changing within the magnetotail. We can only see whether the absolute field measurement is increasing or decreasing. We have no way to determine whether that reading is normal for that day/time or whether something unusual is happening. All we are able to do is look for sudden changes of direction or sudden rate changes. We cannot infer from the amount of change whether it is a weak or a strong substorm because we do not know what a normal amount of relative change is for those magnetometers.
When darkness starts to fall over the US, the GOES magnetometers start to pass into the magnetotail. This causes their absolute field measurement to slowly start to fall. The measurement continues to fall until the satellite reaches the middle of the magnetotail, where it measures its lowest reading at local midnight. The measurement then starts climbing again as the satellite continues travelling towards the opposite edge of the magnetotail and exits from it.
On a quiet night, without any substorms, the GOES plot will show a gentle fall towards local midnight and a gentle climb towards dawn. However, when a substorm happens while the satellites are passing through the tail then you will see abrupt changes in slope or direction of the plots.
The GOES satellites are very sensitive to their precise location within the magnetotail. Earlier or later during the US night, when they are at the edges of the tail, they can miss substorms entirely. They should only be used during darkness for North America, not for anywhere else in the world, because the satellites are only in the position needed to detect substorms when North America is on the dark side of the Earth.
If substorms are already being tracked on ground-based magnetometers, when GOES satellites turn into the middle of the tail, then the satellites can either miss the substorm entirely or react too late.
Just to make things even more complicated, the GOES plots often randomly make an abrupt change of direction for no reason whatsoever.
Another reason why ground-based, substorm tracking is more accurate is that the ground stations are passing directly underneath the auroral oval, only a few hundred kilometres from the actual aurora itself. The GOES satellites are around 42,000 km distant from the actual aurora. It's akin to holding up a thermometer in Tasmania and hoping to measure the temperature in Lapland.
Aurora hunters should always use the substorm tracker on Glendale App as their primary source of substorm information. Never pass up an active substorm on Glendale App to wait for a GOES magnetometer to do something. There's no harm in North Americans taking a few test shots if you do see a change on GOES but be prepared to fail.
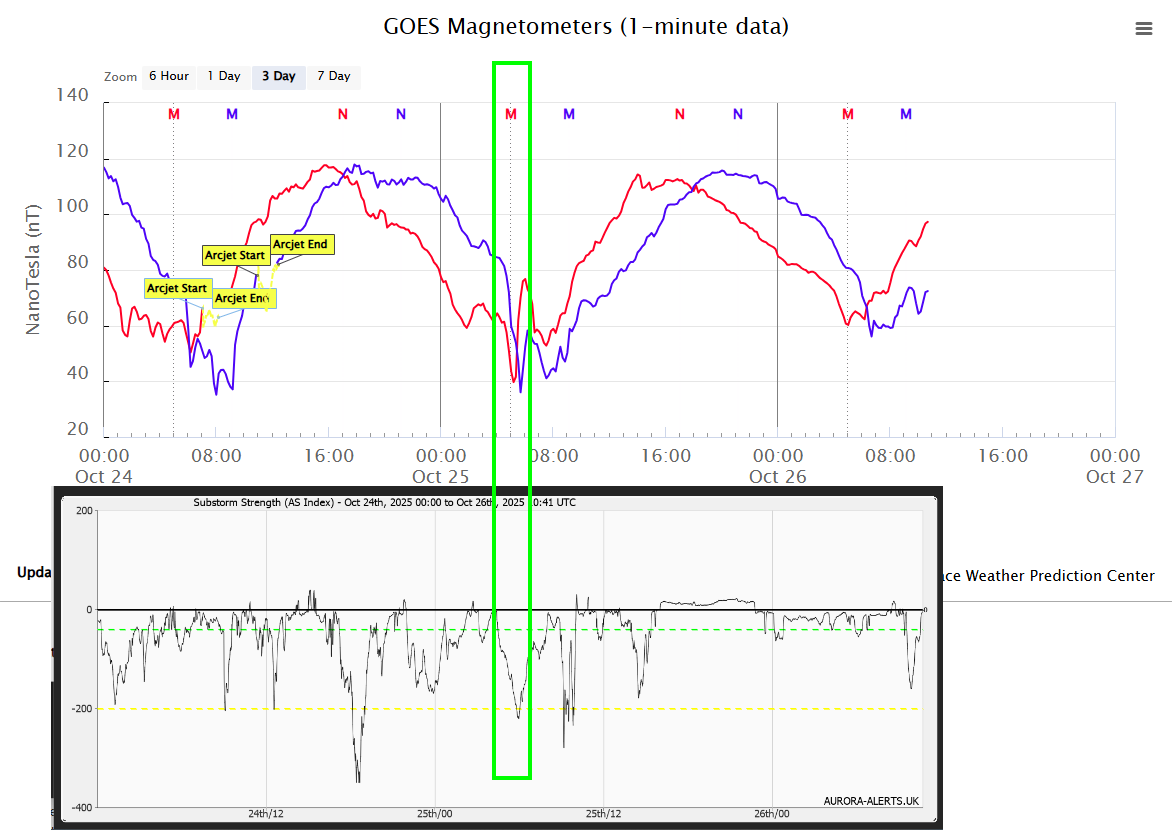
The image above shows a comparison of Glendale App's substorm tracker against GOES magnetometers over a period of around 2.5 days. The section marked with a green box shows where GOES did actually detect a substorm because it occurred close to local midnight on the GOES magnetometers. However GOES missed all the other substorms over the period.
You may also be confused into thinking that GOES detected the onset ahead of the substorm tracker because the recoil on the GOES (red line) came before the peak of the substorm. However, the substorm onset is actually when the substorm tracker plot started to drop negative, not when the substorm peaked. The substorm tracker detected the onset before the GOES recoil*.
*If you have only used GOES magnetometers before and never used substorm tracking then you need to understand the fundamental difference in the way that you read the plots. On substorm tracker, the plot shows the strength of the substorm and tracks the entire substorm. When the line starts to drop from zero that is the substorm onset. When the line is most negative that is the peak of the substorm's expansion phase. When the line climbs again the substorm is starting into recovery. With a GOES plot, you cannot see the substorm, you are looking for a sharp recoil on the line to indicate that there might have been a dipolarisation and, therefore, a possible substorm onset.
Equinox Effects / Russell-McPherron
Some months of the year and certain times of day are statistically more likely to have auroras. You will often see this referred to as the Russell-McPherron effect. This is an extremely complex topic, so I am just going to cherry-pick the most important points to give you a fighting chance of understanding it. There are two important factors at play here called the Equinoctial Effect and the Axial Effect. Before I dive in, there are a few terms I need to introduce...
- The Earth orbits the Sun in a plane called the ecliptic.
- The Earth's geographic north pole (GNP), its rotation axis, is tilted by around 23° relative to the ecliptic, called the axial tilt.
- The Earth's magnetic north pole is tilted by around 10° from its geographic north pole called the dipole tilt.
Equinoctial Effect
Every day, as the Earth spins on its axis, its magnetic north pole rotates around its geographic north pole. This means that the Earth's magnetic field is constantly wobbling relative to the ecliptic.
Over the course of a year, as the Earth orbits the sun, the Earth's axis shifts relative to the sun. In June, its geographic north pole is tilted directly towards the sun. In December, its geographic north pole is tilted directly away from the sun. At the equinoxes, the GNP is at right angles to the sun.
What this means is that at any given time, on any given day of the year, the Earth's magnetic pole will be in a specific, known position relative to the ecliptic. This is unique to that time on that day of each year.
Taking an example of the December solstice, Earth's GNP is tilted 23° away from the sun, relative to the ecliptic. The magnetic pole during the course of the day rotates around the GNP, so at one specific time of day it will be tilted 33° away from the sun and twelve hours later it will be only tilted 13° away from the sun.
The theory behind the equinoctial effect is that the shifting position of the magnetic pole relative to the sun over the course of the day, and through the seasons, creates specific times of day and specific months of the year with increased geomagnetic activity.
Axial Effect
The sun's equator (equatorial plane) is actually tilted around 7° from the ecliptic plane. As the Earth orbits the sun it will be above the sun's equator for six months and below the sun's equator for the other six months. The two extremes, where the Earth is furthest above and furthest below the sun's equator, fall on September 8th and March 6th, respectively. Dates that are fairly close to the equinoxes.
The theory behind the axial effect is that the position of the Earth relative to the sun's equator can create specific times of year with increased geomagnetic activity.
In Practice
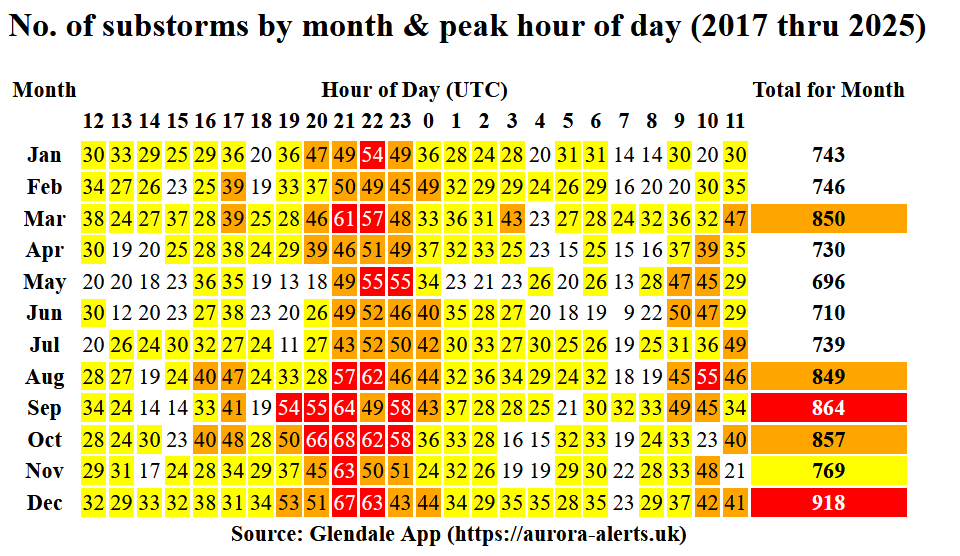
I began testing these theories back in 2017. I recorded the month and the hour when every substorm peaked and combined them into the table shown. At the end of every year, I create a new version of the table.
You can clearly see some of the patterns predicted by the equinoctial and axial effects. There are definite increases in substorm activity around the equinoxes.
You can also clearly see that certain times of day are particularly favoured, with 21:00 until 00:00 UTC being the optimal time of day. This is perfect for aurora chasers in Europe, Iceland and the UK. Also, 09:00 until 12:00 UTC favour the southern hemisphere's winter season, which is good news for chasers in Australia and New Zealand.
The most curious feature of my own empirical data is that December is the stand-out month. Better than the equinoxes.
What Makes Activity Increase?
The exact cause of the increased activity from the equinoctial and axial effects is where the complex science comes in.
The theory behind the equinoctial effect is that the majority of the IMF in the solar wind lies in the sun's equatorial plane, i.e. mostly By in the GSEQ axis system. When this is transformed into the GSM axis system, that we normally use for aurora chasing, some of that GSEQ By becomes GSM Bz and increases geomagnetic activity. This is the explanation proposed by Russell and McPherron, hence the effect being named after them.
With the axial effect, the theory is that geomagnetic activity varies dependent upon the Earth's distance above or below the sun's equator due to it experiencing faster solar wind when away from the sun's equator.
The problem is that no theory entirely fits any empirical data. Even which geomagnetic indices you choose to test the theories against produces different results. This means that the academic literature is littered with alternative theories, another being that the equinoctial effect causes the magnetotail to tilt into the flow of particles from the solar wind and thus facilitating increased energy transfer.
My own data is taken from the substorm tracker in Glendale App. My index differs from other commonly used geomagnetic indices in that it is calibrated against aurora in the sky but, crucially, it is global. The academic indices are biased towards the northern hemisphere and I suspect this contributes to the reason why my auroral substorm index shows the peak month to be December. Even so, you can still see with mine or any other indices that the equinoxes stand out for geomagnetic activity.
My favourite academic paper on this subject is by Mike Lockwood should you wish to delve deep into this topic.
Does it help Aurora Chasing?
You will see many fantastical claims about auroras being 'better' at the equinoxes, that they are stronger, that poor data will produce much stronger aurora at the equinoxes, that the magnetosphere is 'primed' to explode. These are wild exaggerations.
When out in the field, you are chasing the substorms and the substorms are responding to the IMF. A minor substorm doesn't magically produce a moderate aurora at the equinox. A Bz of -1 nT doesn't magically create a substorm that is equivalent to -10 nT on any other night. The data you see is exactly what is arriving and exactly what the magnetosphere is responding to.
The data you see from the satellites and magnetometers is AFTER the equinox effect has been applied, not BEFORE. You just chase with the data exactly the same as you always do and will get the same results as you always do with those data levels.
Auroras can occur at any time of day on any day of year, it just needs the IMF Bz to go negative. If you chase them using Glendale App, you will catch them regardless of time or season.
The equinox effects would only be noticeable if you are chasing repetitively. Say there are two aurora tour guiding companies, one that did their tours from 9pm until midnight UTC and the other went out at midnight until 3am. They would both find auroras. If you compared their success on any given day, or even year, the results would be comparable. However, when you looked at their cumulative success rates over many years, the one that went before midnight would have slightly better totals.
Coronal Hole Polarity vs. Equinox Effect
It is said that the polarity of a coronal hole (CH) can improve aurora at a given equinox. The acronym SNAP is often used, which stands for Spring Negative, Autumn Positive (northern hemisphere), It refers to which polarity of CH works best at each equinox.
Spring and summer are at different times of year in the southern hemisphere, so for the purposes of this article read spring as March/April and autumn as September/October. The alternative acronym, SPAN, is often used for the southern hemisphere.
A positive polarity coronal hole produces IMF with a negative Bx component. Do not confuse this with the Bz component (if only it were that easy!). The name given to the polarity of a hole is all about Bx and nothing to do with Bz.
You will also hear terms like 'away' or 'toward' used in this context, so I have summarised all the definitions in the table below:
| CH Polarity | Direction From Sun | Bx Sign | By Sign | Best Months |
|---|---|---|---|---|
| Negative | Towards | Positive | Negative | March/April |
| Positive | Away | Negative | Positive | September/October |
The theory is that, due to the Parker spiral, the ambient solar wind and coronal hole streams generally produce IMF that lies fairly flat in the sun's equatorial plane. These magnetic field lines are called Radial Field Lines.
These radial field lines trace a curve as they leave the sun, This means that, when there are no CMEs in the solar wind, the By component of the IMF will usually have the opposite sign to the Bx component, as shown in the table above and the figure below.
This link between Bx and By, whereby they usually have opposite signs to each other, works with the equinox effect to convert the By in GSEQ axes into Bz in GSM axes.
In the spring (northern hemisphere), negative By in GSEQ axes enhances geomagnetic activity but positive By doesn't. Negative By would usually be associated with a positive Bx and, therefore, the theory is that a negative polarity coronal hole is better in spring.
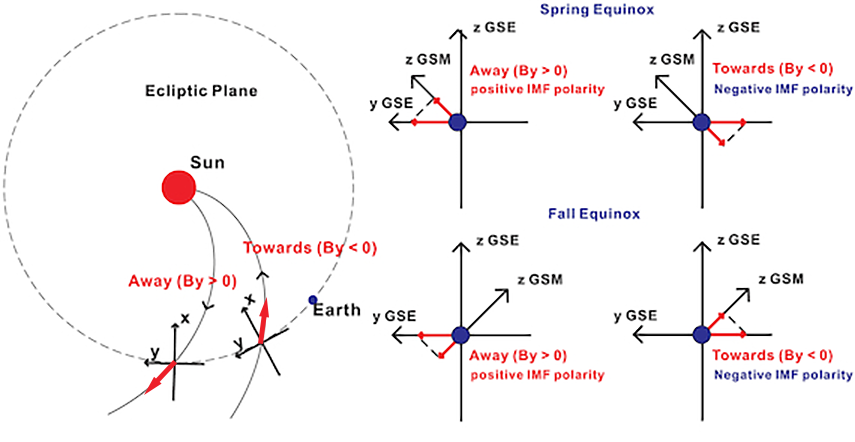
Figure showing the R-M Effect (source)
The drawing on the left of the figure shows two radial field lines, one towards the sun and the other away from the sun. It illustrates how a negative Bx usually comes with a positive By, and vice versa, due to the Parker spiral.
The drawings on the right of the figure illustrate how the axis conversion converts By into Bz around the equinoxes when the By component is positive and negative.
* In the figure, the words 'towards' and 'away' are referring to Bx. The By in brackets is referring to the pattern of By taking the opposite sign to Bx.
The problem with this theory is that the (non-CME) IMF doesn't actually lie 'fairly flat' in the sun's equatorial plane in real data. It has plenty of tilts and plenty of natural, negative Bz. It doesn't really need any help from Russell-McPherron. Regardless of the polarity of a coronal hole, it will still deliver the goods, whatever the season, if the Bz goes negative.
Another point worth noting, is that surely if the equinox effect can boost activity when the signs of By and Bx are in the 'correct' orientation, it must also have a counter-effect when the signs are 'incorrect'? However, that doesn't fit with the empirical data. The academics try to explain this away by saying that the R-M effect is half-wave rectified, so only the positive boosts apply and the negative boosts are ignored.
Just ignore the polarity and chase the data exactly as you would on any other night. Look at the long-range forecast on Glendale App and you can see how strong the substorms were on the hole's last rotation. If it was delivering the goods 27 days ago, it has the potential deliver that again this time around.
GSM Axes
GSM axes can be a real head-scratcher for many people. This is the axis system used for IMF data that we receive from space weather satellites.
What makes this one so confusing for people is that the vertical axis (XZ plane) passes through the Earth's magnetic north pole, NOT the geographic north pole.
This means that the vertical axis is continually moving left-to-right-to-left over the course of every day, relative to both the Earth's true north pole and the ecliptic.
GSM axes are perfect for aurora-chasing because the data we see is presented exactly how it affects our magnetosphere. We don't need to make any adjustments or corrections to compensate for equinox effects, axial tilt or dipole tilt.