Glendale App - Worldwide Aurora Alerts
WARNING : You have prevented the app from using your location, so all local times and forecasts will be inaccurate. You will be unable to report sightings and may be seeing a version of the app for the wrong country.
Location is automatically blocked by default on Apple devices. You have to fix it yourself otherwise this app will not work properly.
DO NOT REFRESH YOUR SCREEN
You are now frozen out for at least 60 seconds.
Wait patiently or come back later. Never refresh your screen. The app will automatically refresh as fast as it is able. Help
Loading Popup
If you are constantly seeing the blue loading popup, it is because you are either refreshing the screen or repeatedly closing/re-opening the app. This puts unnecessary strain on the server which can cause it to overload at peak times.
Learning how to avoid this will help you have a much better experience with your device and also help me to provide a service to more people at busy times.
In most cases, this is because you have a three-button Android device and are using the 'back' button instead of the 'home' (middle) button. Try using the middle button on your phone instead of 'back' and everything will work much more efficiently.
'Back' closes apps, instead of minimising them. This means that when you come back to the app a few minutes later it has to fully reload itself. Use the middle button and all apps will load instantly.
More help is available on the Support Page.
Tonight:
| A status report will normally be posted by 7pm each evening, with further updates as things develop. |
Last night:
Glendale App is the world's most accurate aurora alerting and forecasting app. Over 215,000 users.
Register to activate the full features of the app. Pro bono. No SPAM. No advertisements. No marketing. No cost. No begging. No fund-raising.
You need to login or register to see live, real-time updates. You are seeing only sample data at the moment.
Who's Shouted Tonight?
Noctilucent Clouds
| Elevation | Azimuth | |
|---|---|---|
| Sun Position | ||
| NLCs | Cirrus | |
| Max Height | ||
Twilight Arc Tracker
How do I use the twilight arc tracker?Noctilucent Clouds
Noctilucent clouds are lit by sunlight in an area of the night sky called the Twilight Arc.
My twilight-arc tracker is constantly monitoring the position of the sun at your location and calculating the position and height of the twilight arc.
The centre of the twilight arc is at the sun's azimuth. The sun's elevation is its angle above (or below, if -ve) the horizon.
The 'Max Heights' are the maximum angles above the horizon that Noctilucent Clouds and Cirrus can be lit directly by sunlight.
NLCs are only visible when the sun is in a narrow range of angles below the horizon that are dependent on your latitude. The optimum times, when you have the highest chance of seeing them are shown.
They are much rarer than auroras, typically seen fewer than 15 nights per year. They are clearly visible by eye, even in towns and cities.
There is no way to predict noctilucent clouds. The trick is to look every night at the optimum times given on this app and you will get lucky.
Substorms
Acknowledgements
Global, real-time tracking of auroral substorms is only possible due to some incredible organisations allowing me to access the live data from their magnetometer arrays.
I am indebted to the kindness and generosity of the Tromsø Geophysical Observatory, Swedish Institute of Space Physics, the US Geological Survey and the Finnish Meteorological Institute for letting me access their live data feeds.
I am also indebted to I.R. Mann, D.K. Milling and the rest of the CARISMA team for use of data from the Canadian magnetometer array. CARISMA is operated by the University of Alberta, funded by the Canadian Space Agency.
Substorm tracking relies on data collected at magnetic observatories. I thank the national institutes that support them and INTERMAGNET for promoting high standards of magnetic observatory practice (www.intermagnet.org).
Also, based upon data provided by the British Geological Survey © UKRI. All rights reserved.
Mann, I. R., et al. (2008), The upgraded CARISMA magnetometer array in the THEMIS era, Space Sci. Rev., 141, 413�451, doi:10.1007/s11214-008-9457-6.
Substorm Tracker
The headline figure -100 nT is the strength of the aurora in the sky right now, called the substorm strength*.
Watch this number! You want it negative. The more negative it is, the stronger the aurora is at that minute. Falling is good, rising is bad. It tracks the strength of the actual aurora in the sky in real-time. It is the single most important number on the app and overrides all others.
When it says 'growth', the substorm is charging up like a battery. When it says 'expansion' that energy is being released as aurora. When it says 'recovery', the aurora will slowly begin to fade.
The trendline shows the changes in strength over the last hour. The line dropping sharply downwards is good. Rising is bad. The blue shaded area indicates the ambient level.
*Auroral Substorm Index (AS Index).
IMF (at Earth)
| Loading... |
Bt/Bz
EXPLAIN IMFIMF
IMF tells us about the future, not the present. We use it to predict activity 1 to 3 hours from now.
The table shows an analysis of the interplanetary magnetic field in the 30 minute window that is currently arriving at Earth, together with windows either side of it. The 'percentage' figure indicates how negative the Bz was, the ideal is 100% negative.
If the 'now' and 'next' rows are both lit up, the substorm will continue if one is active or will start in about an hour if one isn't active.
If the 'next' row is not lit up, the activity will start to wane if a substorm is active but there can be an extra burst of activity, so wait an hour.
When a substorm is in its expansion phase all of these values are irrelevant to that substorm. Substorm strength overrides all other metrics.
The trendlines show the Bz and Bt that is arriving at Earth now (left) and as far into the future as it is possible to see, at L1 satellites (right). Bt is at the top, Bz in the middle and the optimum Bz at the bottom (grey).
The middle line is the important one. You want it to be negative, below the zero line, and as close to the lower grey line as possible.
Solar Wind
| Speed (V) | Loading... | |
|---|---|---|
| Density (N) | Loading... | |
| Pressure | Loading... |
Ions & Electrons
Solar Wind
EXPLAIN WINDSolar Wind
This is the mean velocity, density and pressure of the solar wind that is currently arriving at the Earth. They don't directly matter for aurora. IMF is what matters. A good IMF will lead to aurora even when speed and density are at ambient levels.
We use solar wind data to look for space weather events that might bring us good IMF. Primarily we look for shocks, which are simultaneous large steps on the graphs.
When a substorm is active, all of these values are irrelevant. Substorm strength overrides all other metrics.
Aurora is all about magnetic fields (IMF-driven). Speed and density do NOT affect physical characteristics of the aurora such as brightness, colour or viewing latitude. Nor do they have any affect on the substorm process itself.
The trendlines show the solar wind speed (V), density (N), temperature (T) and IMF strength (B) that is arriving at Earth now (left) and as far into the future as it is possible to see, at L1 satellites (right). The blue shaded area indicates the ambient level.
The 'ion and electron' chart shows counts of suprathermal particles arriving at Earth. The ions are the thick line and electrons the thin line. The lines climbing sharply indicates that a space weather event is approaching. Ion values rise sharply in the hours before an interplanetary shock. Electrons rise sharply in the hours following strong solar flares, especially those that produced an Earth-directed CME.
Coronal Holes
Coronal Holes
How do I use coronal holes?Coronal Holes
Coronal holes cause most of our auroras and they are regular, repeating on a 27 day cycle. Plasma from an Earth-facing coronal hole typically takes 3 to 4 days to reach us and spark auroras.
Flipping between the 'now' and '-27 days' tabs allows you to see how coronal holes have changed since their last rotation 27 days ago.
The '-4 days' tab allows you to see how the coronal hole looked when it was in the earth-facing position 4 days ago.
Solar imagery courtesy of NASA/SDO and the AIA, EVE, and HMI science teams. GOES SUVI imagery courtesy of the NOAA SWPC. SDO images and movies displayed on this webpage are courtesy of NASA, and the respective AIA and HMI science teams at Lockheed Martin and at Stanford University.
Coronal Mass Ejections
Recent CMEs
| Loading... |
Unverified CMEs
| Loading... |
Coronal Mass Ejections
How do I use CMEs?CMEs
Coronal Mass Ejections are bursts of plasma that sometimes erupt from sunspots, during a solar flare, or from filaments. They can trigger the strongest auroras if they hit Earth.
You are looking for plasma surrounding more than 50% of the solar disk in this graphic (a partial halo). The ideal is a 'full halo', where plasma appears to surround the entire solar disk. It then takes 2 to 3 days for the CME to reach Earth.
Even when there appears to be an Earth-directed component or it looks like a direct hit, the CME can still miss completely or bounce off the Earth's magnetosphere. Don't get too excited until the app alerts that a shock has been detected!
Don't take any ETAs too seriously, either here or on other sites, as they are only a very rough guide.
Unverified CMEs are those automatically detected by the app that haven't been manually reviewed yet to confirm that they are valid and Earth-sided.
CME data and graphics derived by Glendale App from solar imagery kindly provided by SOHO.
Solar Flares
5-Day Maxima
| Loading... |
Best Recent
| Loading... |
Solar Flares
How do I use solar flares?Flares
Solar flares from sunspots sometimes produce a CME which, if directed earthward, can cause strong substorms between two and four days after the eruption.
Most flares don't produce a CME and most CMEs miss the Earth, so don't get too excited about flares.
Flares are classed A, B, C, M or X with A being weakest and X being strongest. The number indicates how strong the flare was within its class.
After a flare, it can take several hours before imagery becomes available that enables us to determine whether there was a CME and whether that CME was Earth-directed. After a flare, keep checking the Coronal Mass Ejections panel for the latest updates as imagery arrives.
The image shows the active region that was the source of the most recent solar flare, highlighted with a circle. When there have been no recent flares it shows the latest image of the solar disk. The images are annotated with the sunspot (active region) numbers. These are colour-coded based on magnetic complexity.
Solar imagery courtesy of NASA/SDO and the AIA, EVE, and HMI science teams. GOES SUVI imagery and Region Summary data courtesy of the NOAA SWPC. SDO images and movies displayed on this webpage are courtesy of NASA, and the respective AIA and HMI science teams at Lockheed Martin and at Stanford University. CCOR images courtesy of NOAA SWPC and NASA.
Long-Range Forecast
| Loading... |
Long-Range Forecast
How do I use long-range data?Long-Range Forecast
Dates that are coloured black are uncertain. Dates shown in colour are more likely. Dates that are missing have no predicted activity.
This forecast should only be used for dates 10 to 27 days in the future. Up to 9 days ahead we can see the actual hole on the solar disk.
The sun spins on its axis effectively every 27 days, which means that coronal holes and active regions giving us auroras today can rotate back around again in 27 days time, giving another show.
These are the dates when solar wind streams that gave us good auroras will rotate around again. There is no guarantee that the coronal holes that caused the substorms on the previous rotation won't have closed but they also may have got larger. You can only use these as a guide but this is the most accurate long-range forecast for the UK, Ireland, Iceland, Scandinavia, North America and Australasia that you will find anywhere in the world.
It is essential to check the coronal holes panel, as we get closer to the dates that interest you, to confirm the current status of the hole that caused the activity, as it might have closed.
This forecast is based on my own data collected in the UK and is valid worldwide. The more negative the figure, the stronger the aurora could be.
* You need to register to view the full 28-day forecast.
Twilight & Moon Times
| Loading... |
Your Details
Reset Password
If you have forgotten your password, an email will be sent to your registered email address with a link to reset it. Click 'Reset Password' button and follow the instructions in the email to log back in.
Forgot My Name
If you have forgotten what your own name is, an email can be sent to your registered email address with a reminder. Click 'Send My Name' button and a reminder will be sent to you.
Your Details
Entering your details here will allow you to make instant, live, aurora reports to let others know what the current situation is where you are. You will also be able to see reports from other users, access all features of the app and see the live data in real-time.
Enter the exact same details on all devices where you use the app to synchronise your history and reports across them all.
If you work as an aurora tour guide, researcher, scientist or are an admin on an aurora facebook site you can enter those details and they may be shown to other users.
Account Rules
Your actual name, your actual email address and the name of your nearest town/village are required to use this app. Only your first and last name are required. Abuses will result in the account being de-activated. This includes nick-names, truncation, obfuscation, business names, junk, burner emails, emails that bounce, etc.
Privacy Policy
This app collects sighting reports you make for purposes of scientific research, to improve the accuracy of aurora forecasting and for alerting users when the aurora is active.
Your personal data is not shared with any other organisations or third parties.
You will not be spammed. You may be contacted about interesting reports you have made, problems you are having with the app or security/authentication issues.
This app only uses essential cookies.
Why is my account de-activated?
The commonest reason for your account being blocked is that you have a mistake in your email address. If the account activation email bounces your account will automatically be blocked. Check your email address very carefully. It may also be due to your name failing to meet the account rules.
Why haven't I received an activation email?
The commonest reason that you haven't received an activation code is that you have a mistake in your email address. Check your email address very carefully. If you are certain the email is correct then it is most likely your spam filter, to unblock this email me from the email account you are registering with and request a code.
Your History
Your Annual Totals
Your Reported Aurora Dates
Your Reported NLC Dates
Add Late Reports
Insights
Alerts & Settings
Your phone is android and is capable of receiving alerts but you need to install the Chrome app and make it your default web browser. You are currently using the Samsung web browser.
To install this web app on your device:
Open Safari.
Go to aurora-alerts.uk.
Press SHARE button in Safari (NOT 'share' in the app).
Scroll right.
Add to Home Screen.
Add (top right).
Open Chrome or Firefox.
Go to aurora-alerts.uk.
Click the red 'install the app' button.
Open the Chrome App.
Go to aurora-alerts.uk.
Click three vertical dots icon (top right).
Add To Home Screen.
Click 'Enable Alerts'.
App installed and tile added.
Alerts
The basic alerts are push notifications that the app sends automatically when it detects that an aurora is developing. An 'onset' alert is sent first as a warning that an aurora is starting, followed by yellow, amber, red, major, severe and extreme alerts as activity develops. Your device will receive these even when the app is not running.
The 'Expansion Alarm' is designed for desktop users. If you leave the app running in 'alarm mode' on your PC, the app will start bleeping as soon as it detects a substorm heading into expansion phase to give you time to head out and catch it at its peak.
'Activity Alerts' are notifications that can be set to 'ping' your device only when the app is running. These occur much more frequently than the basic alerts. They alert you to all thresholds being crossed, auroras being reported by users and photos being uploaded. These are great for users of desktop PCs who want to keep constantly updated on the current aurora situation.
Alerts are available for both Apple and Android devices via Telegram at https://t.me/GlendaleApp
Graphs (At Earth in UTC Time)
Substorm Strength (24 hour)
Substorm Strength
How do I use the 24 hour graph?Substorm Strength (24-Hour)
The plot shows the substorm strength* over the last 24 hours, which allows you to see the periods when the aurora was at its best.
The more negative the figure, the stronger the aurora was.
These graphs are deliberately produced 5+ minutes behind real-time. Use the Substorm Panel above for aurora-hunting.
These graphs allow you to verify the accuracy of this app by comparing the times of your best photos against the substorm strength the following day. You will see that your best photos were taken precisely on the best drops. Remember that the graphs are in UTC time, not your local time.
*Auroral Substorm Index (AS Index).
IMF Bt / Bz (24 hour)
IMF Bt / Bz
How do I use the 24 hour Bt & Bz?The plot shows the IMF Bt (black) & Bz (red) over the last 24 hours, which allows you to see the periods when the IMF was strongest.
The pale green line shows the By.
IMF Clock / Theta (24 hour)
Clock / Theta
How do I use the 24 hour theta?The plot shows the clock angle (θ) over the last 24 hours, which allows you to see the periods when the IMF was best aligned.
Speed & Density (24 hour)
Speed & Density
How do I use the 24 hour speed & density?The plot shows the solar wind speed & density over the last 24 hours.
TGO Stackplot (24 hour)
Norwegian-Line Magnetometers
How do I use the stackplot?The chart shows magnetometer deflections at every station on the entire Norwegian array from north to south, in descending order of latitude, plotted over the last 24 hours.
Sharp drops correspond to substorms in their expansion phase. Ideally what you are looking for on the stackplot are drops of >200nT on the right-hand side of the graph. The scale is shown top-right.
This should not be used for real-time aurora-hunting. Use the substorm panel at the top of the app instead, as it reacts faster and translates all the squiggles into a single, easy-to-use number.
Stackplot courtesy of the Tromsø Geophysical Observatory.
Graphs at Earth
The 'at-Earth' graphs allow you to see when activity was happening over the last 24 hours. These should not be used for real-time aurora-hunting, as they are deliberately delayed. They are intended to be used to correlate the timestamps on your images taken last night against the data that was being shown on Glendale App at the time. This helps you to verify how accurate the app is at tracking the actual aurora that was happening in the sky. Times are in UTC, so you will need to consider your UTC offset.
The 'substorm strength' graph is the main graph for retrospective use. It shows you when all of the substorm activity was happening. You will see that the times of peak activity on your images correspond to the peak drops on the graph.
The other graphs are all adjusted to the Earth-time frame of reference and aligned vertically so that you can easily see how the other parameters influence the substorms.
These are an educational tool to help you understand how the aurora you captured last night corresponds to the relevant data.
Graphs (At Satellite in UTC Time)
ACE Solar Wind (2 hour)
Solar Wind at ACE
How do I use the solar wind?Ideally what we want is either a negative Bz, or a very wide separation between the Bz and Bt lines, over the course of the last hour.
Solar wind graphs courtesy of the NOAA SWPC.
Stereo graphs courtesy of the STEREO Science Center
Solar Orbiter graph courtesy of the Imperial College London.
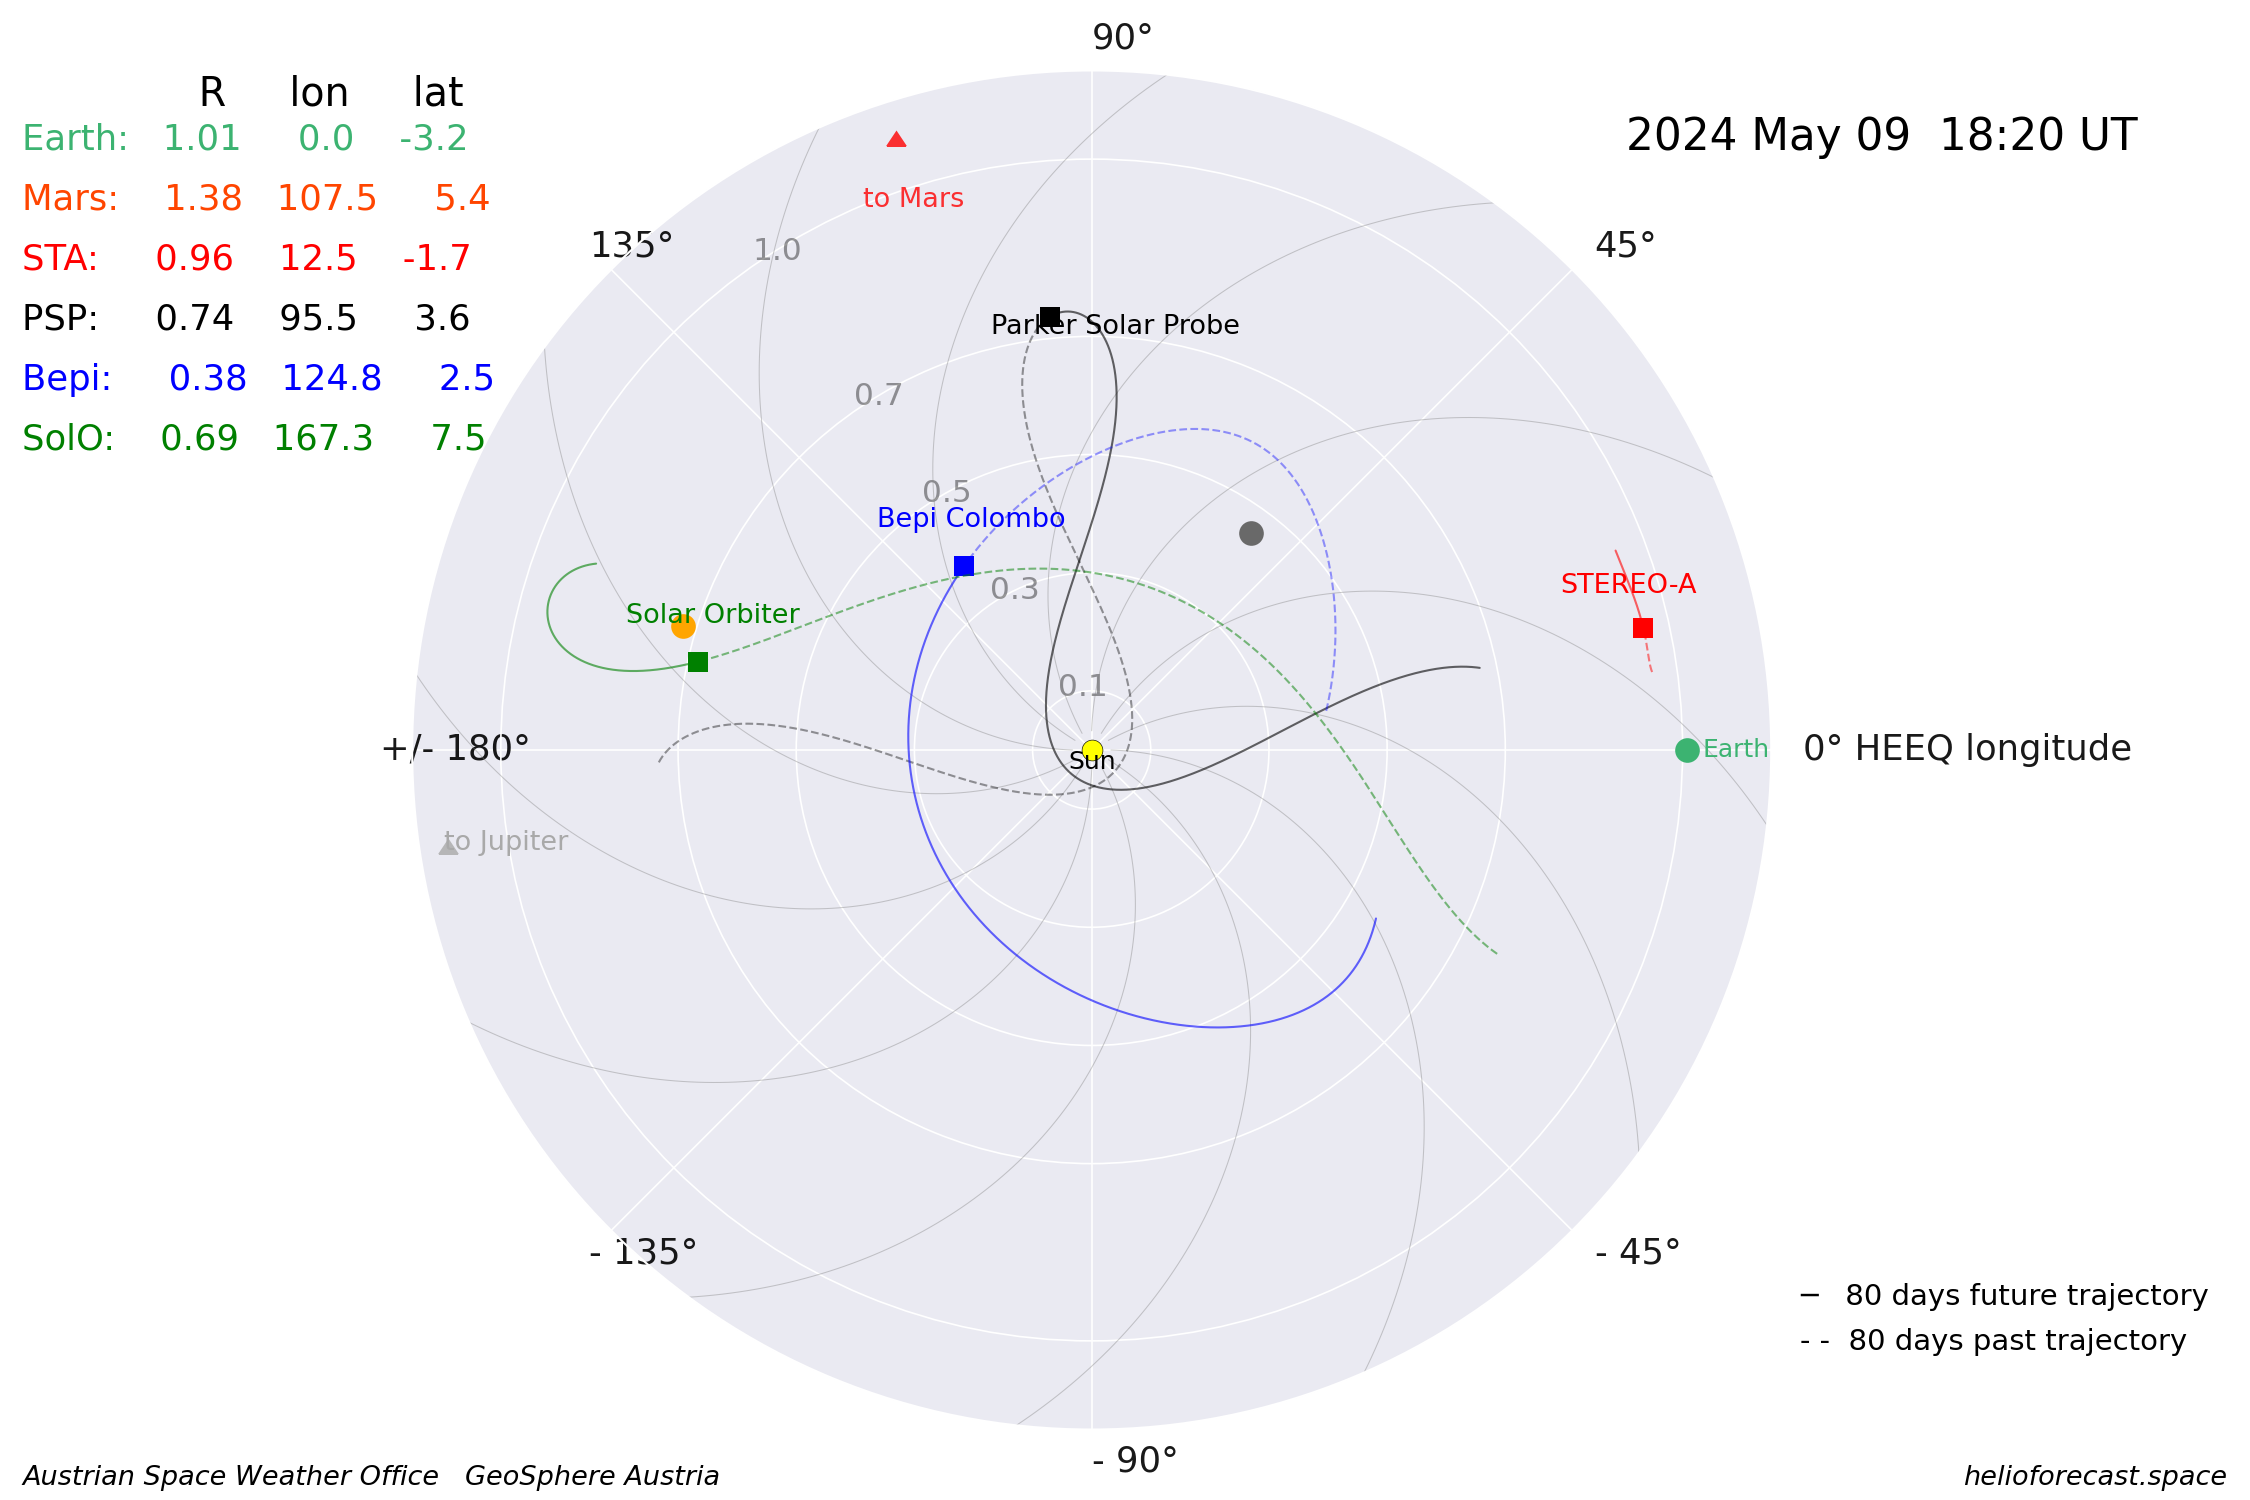
Solar Orbiter ephemerides courtesy of the Austrian Space Weather Office.

Your GPS Position
Your GPS Co-ordinates
This allows you to verify that you have enabled location services correctly in your device and confirm what lat/long your device is giving to the app. If these are wrong then all forecasts and times given on the app will be incorrect. It is vital that you resolve any issues.
Your location in geomagnetic co-ordinates is also given, which allows you to see how much closer your effective latitude for auroras is to your true latitude.
Help, Support & Links
Glendale App was created by Andy Stables of the Glendale Skye Auroras Facebook Page to make it easy for people to see and photograph auroras worldwide. It is the result of research carried out on a daily basis since September 2012 in the Isle of Skye.
The world-leading accuracy of the app is only possible due to the generosity of the Tromsø Geophysical Observatory, the Swedish Institude of Space Physics, the US Geological Survey, the Finnish Meteorological Institute and the CARISMA team in allowing me to access the live data feeds from their entire magnetometer arrays around the northern hemisphere.
The wonderful icons for the tiles, badges and logo were the work of Andrew Liley from Portree.
The Iceland Version of the App was only made possible thanks to many hours of detailed observation and recording by Caroline Weir from Reykjavik, who runs the Aurora Iceland Facebook Group.
Read the full behind-the-scenes story of Glendale App here.
Europe, Canada & Oceania Maps by vemaps.com.